
006 : NYC 311 Analysis
The NYC 311 Service Requests Analysis project aims to delve into the rich dataset
provided by New York City's 311 system to uncover valuable insights and trends related to various service
requests made by residents and visitors.
The NYC 311 system serves as a central hub for individuals to report non-emergency issues, request
information, and seek assistance from the city's agencies.
This analysis will involve collecting and analyzing a vast array of service request data, including the
type of request, location, time of submission, agency response time, and resolution status. By applying
data mining, statistical analysis, and visualization techniques,
I will uncover patterns, anomalies, and trends that can provide a deeper understanding of the city's urban
challenges, public service effectiveness, and community needs.
Project color palette:
                  colors = ["#5f8e00","#84c600","#d6ecaa","#1c335e","#2ec7ab","#b9ece3",
                  "#e8ac65","#c7006a","#ff1f62","#ffb4cb","#ff8214"]
                  palette = sns.color_palette(palette = colors)
                  sns.palplot(palette, size =1)
                  plt.show()

Project dataset:
                  nyc_df = pd.read_csv("311_Service_Requests_from_2010_to_Present.csv")
                  nyc_df.head()
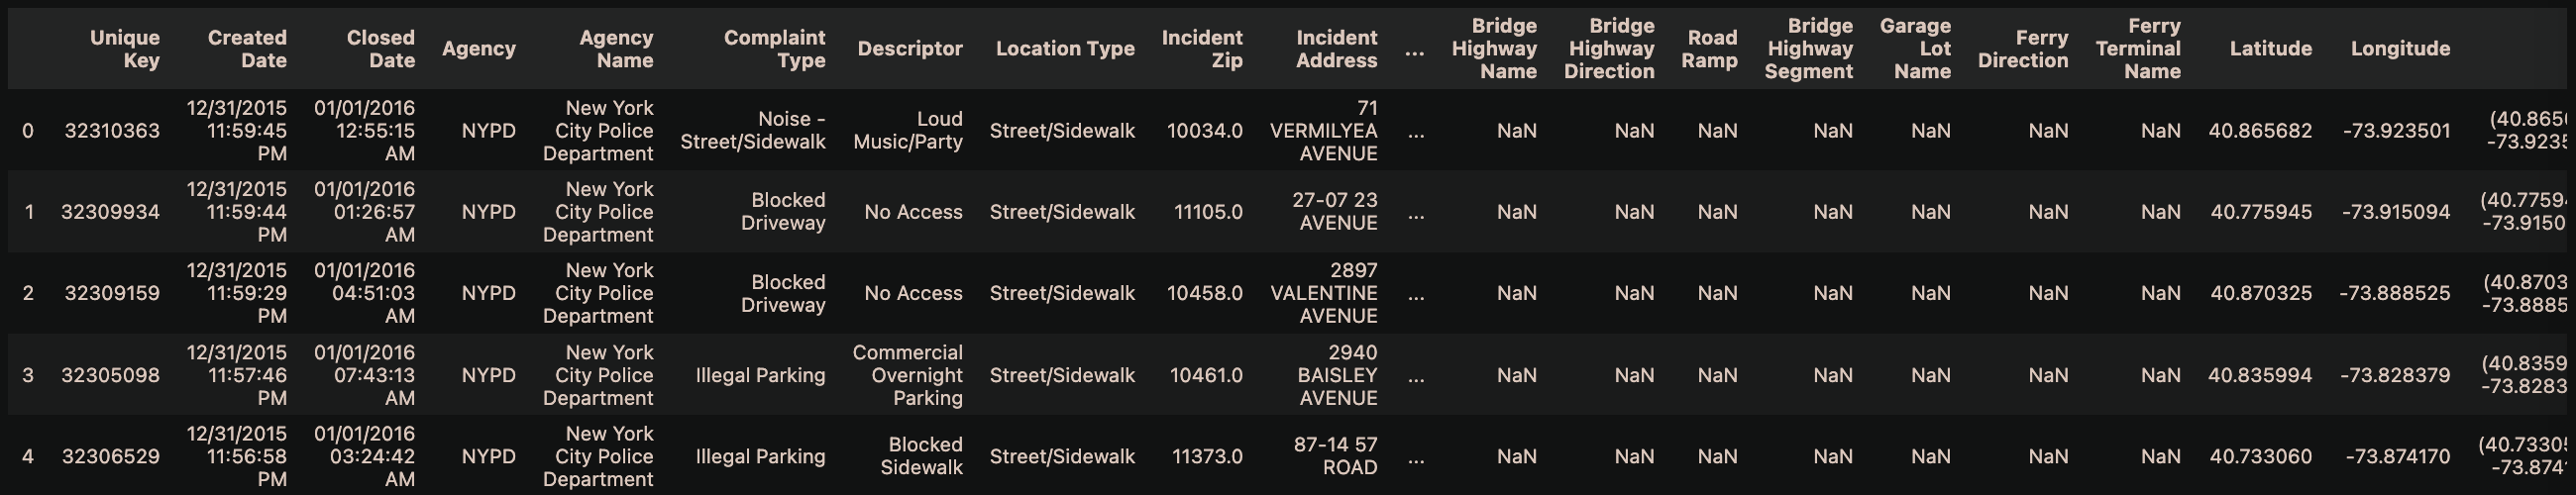
Basic EDA
The dataset has 53 attributes and 364.588 observations.
In which, there are object type and numeric type of data.
Let's observe the data descriptive information.
                nyc_df.describe(include= "number")
                nyc_df.describe(include= "object")
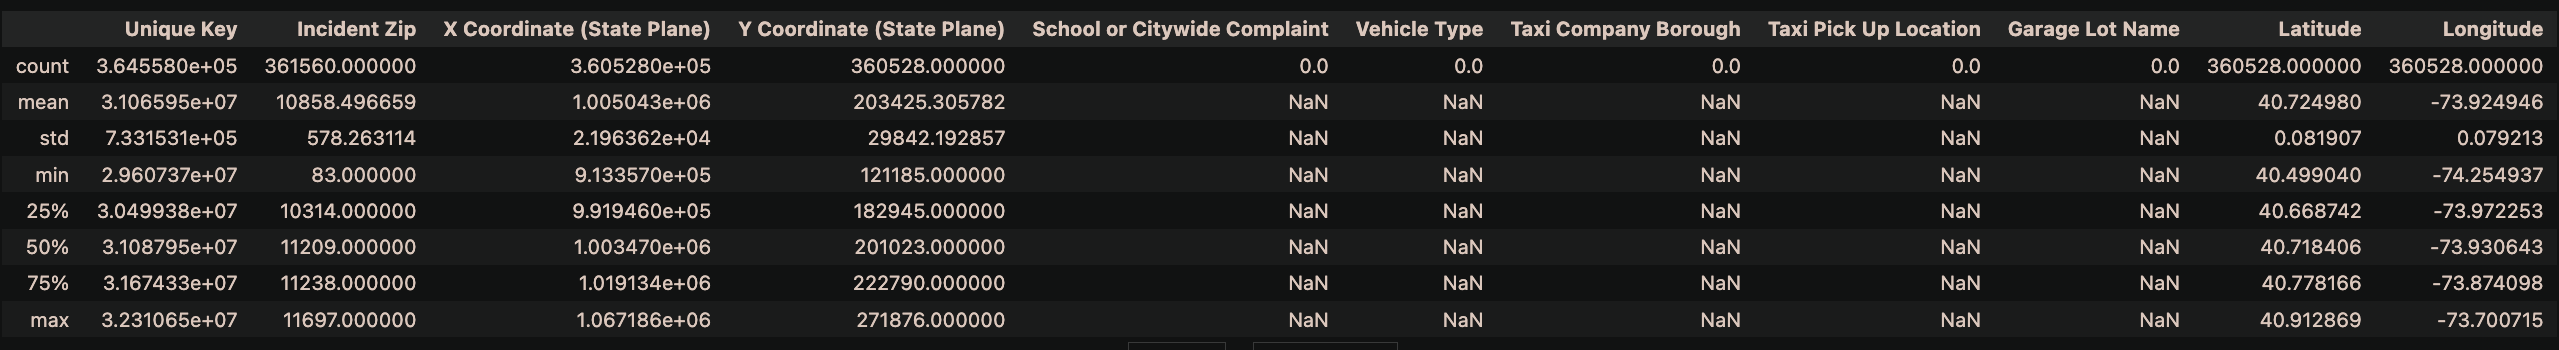
It could be seen that, for numerical atrributes: School or Citywide Complaint,
Verhicle Type, Taxi Company Borough, Taxi Pick Up Location and
Garage Lot Name
are all missing values with their count of row equals to 0 and all
other statistical value are NaN.
Hence, we should dropna for these 5 columns.
Moreover, for object attributes, it looks like there are many incomplete columns and some columns have only
1 unique value, which may not be very informative and useful.
                mn.matrix(nyc_df.select_dtypes(include= "object"))
                mn.matrix(nyc_df.select_dtypes(include= "number"))
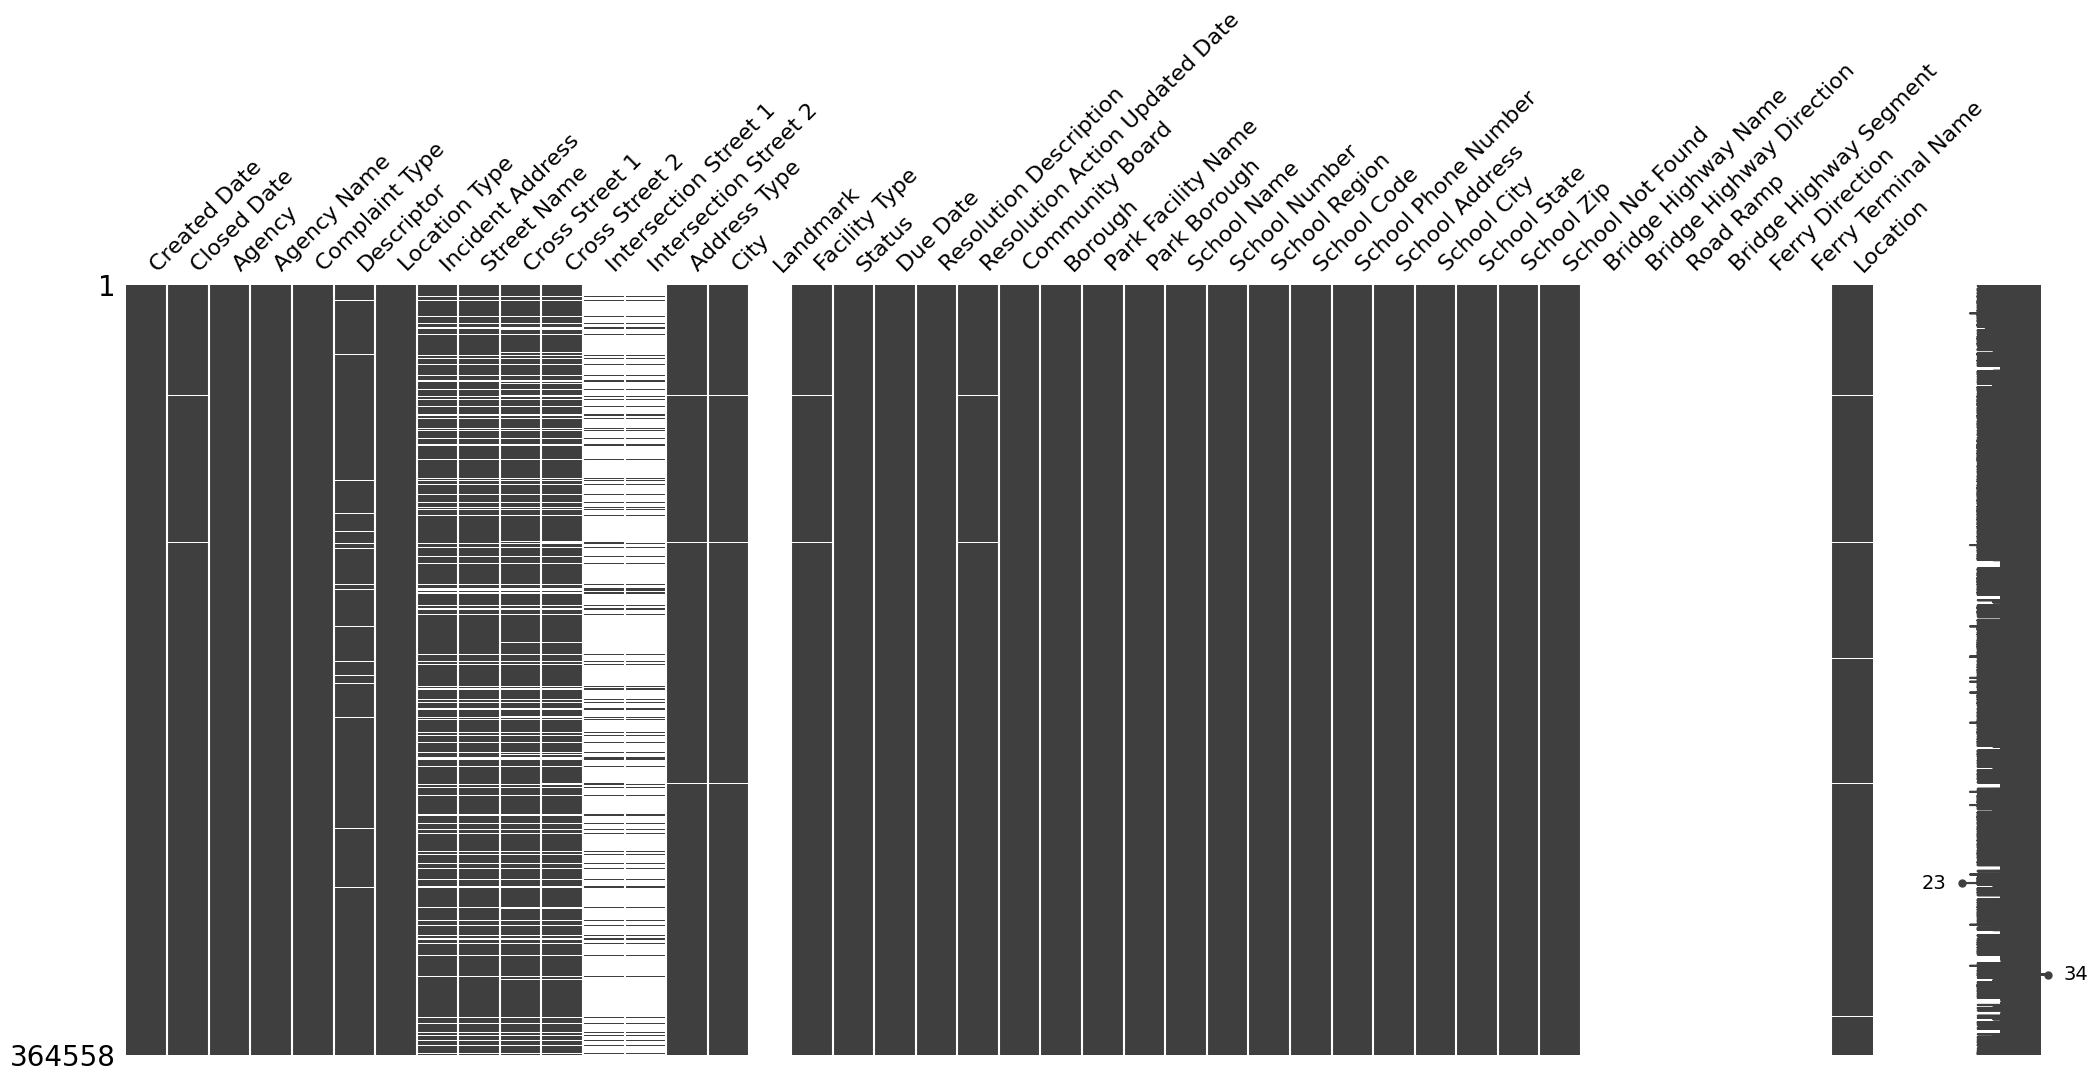
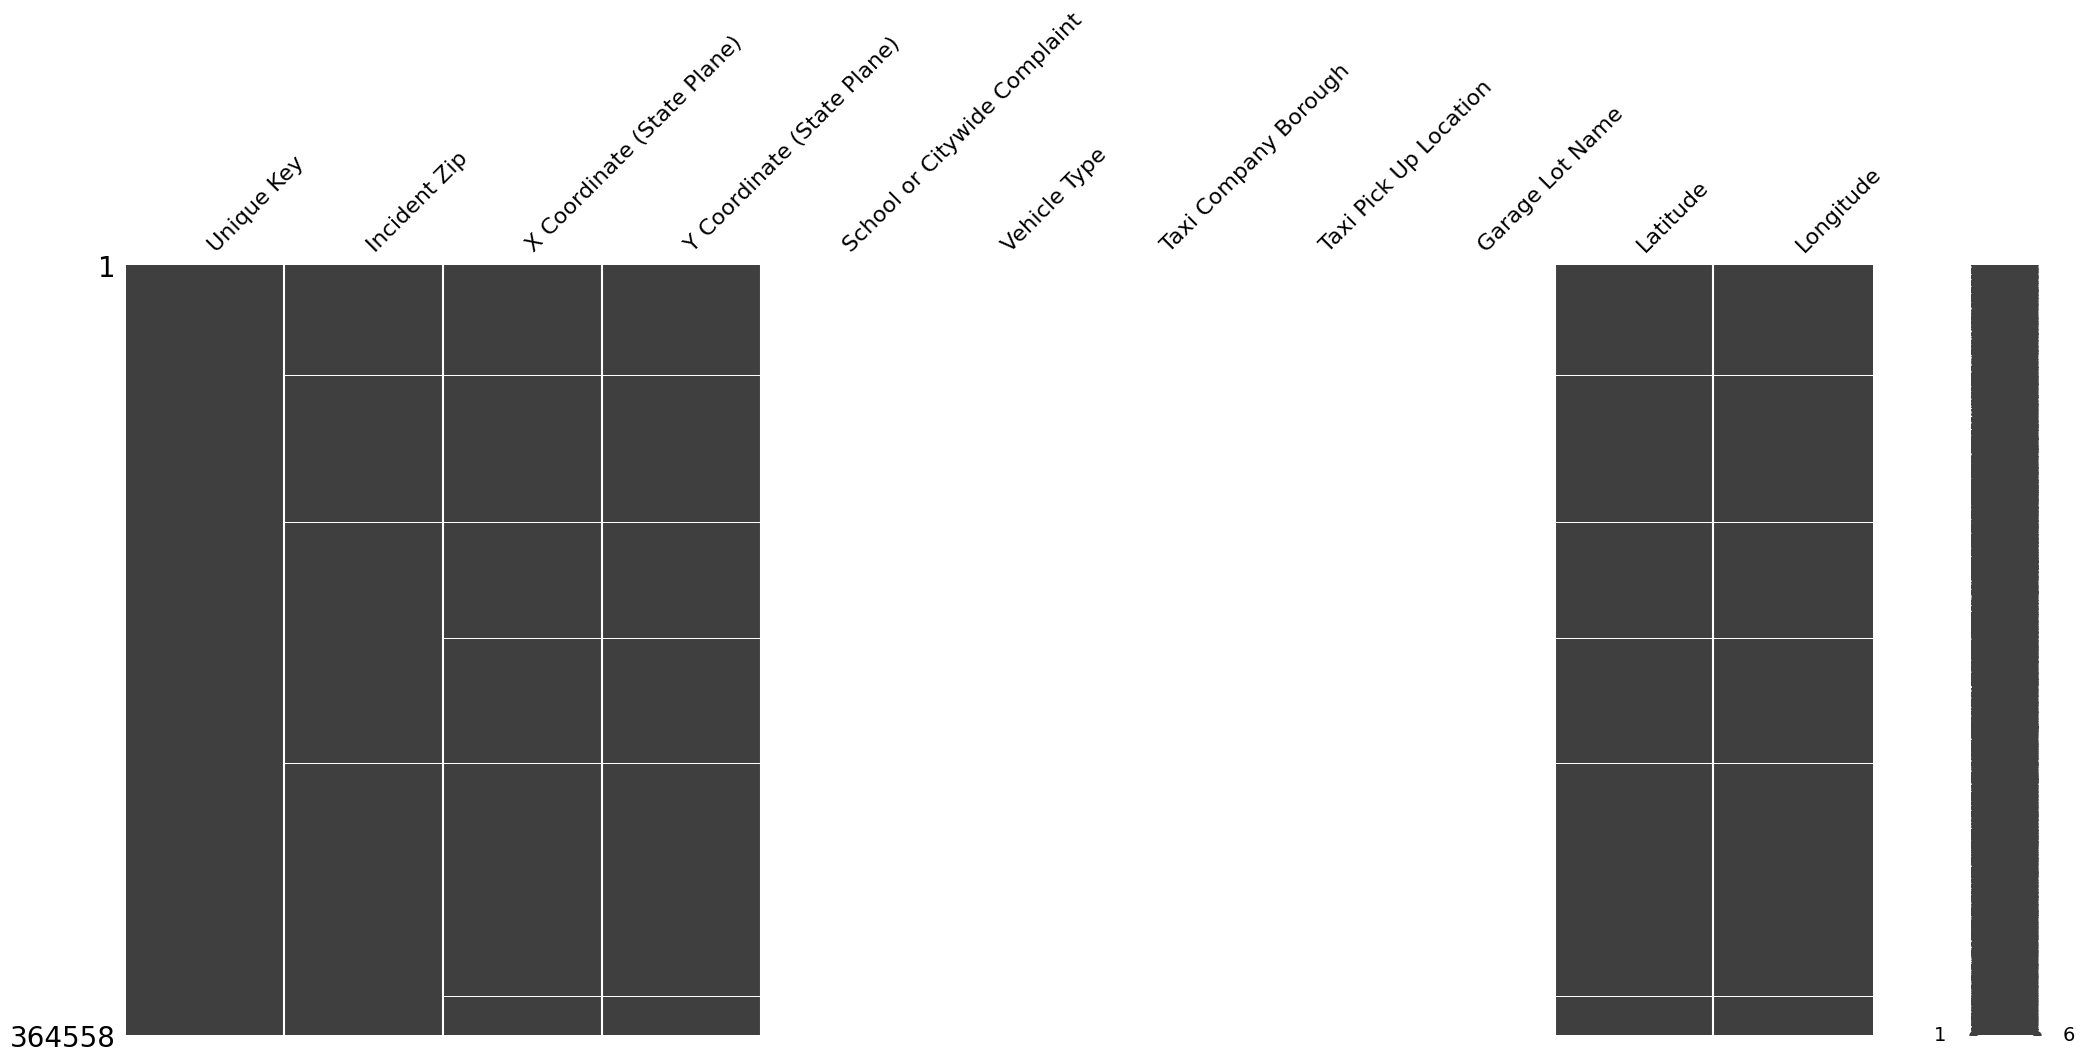
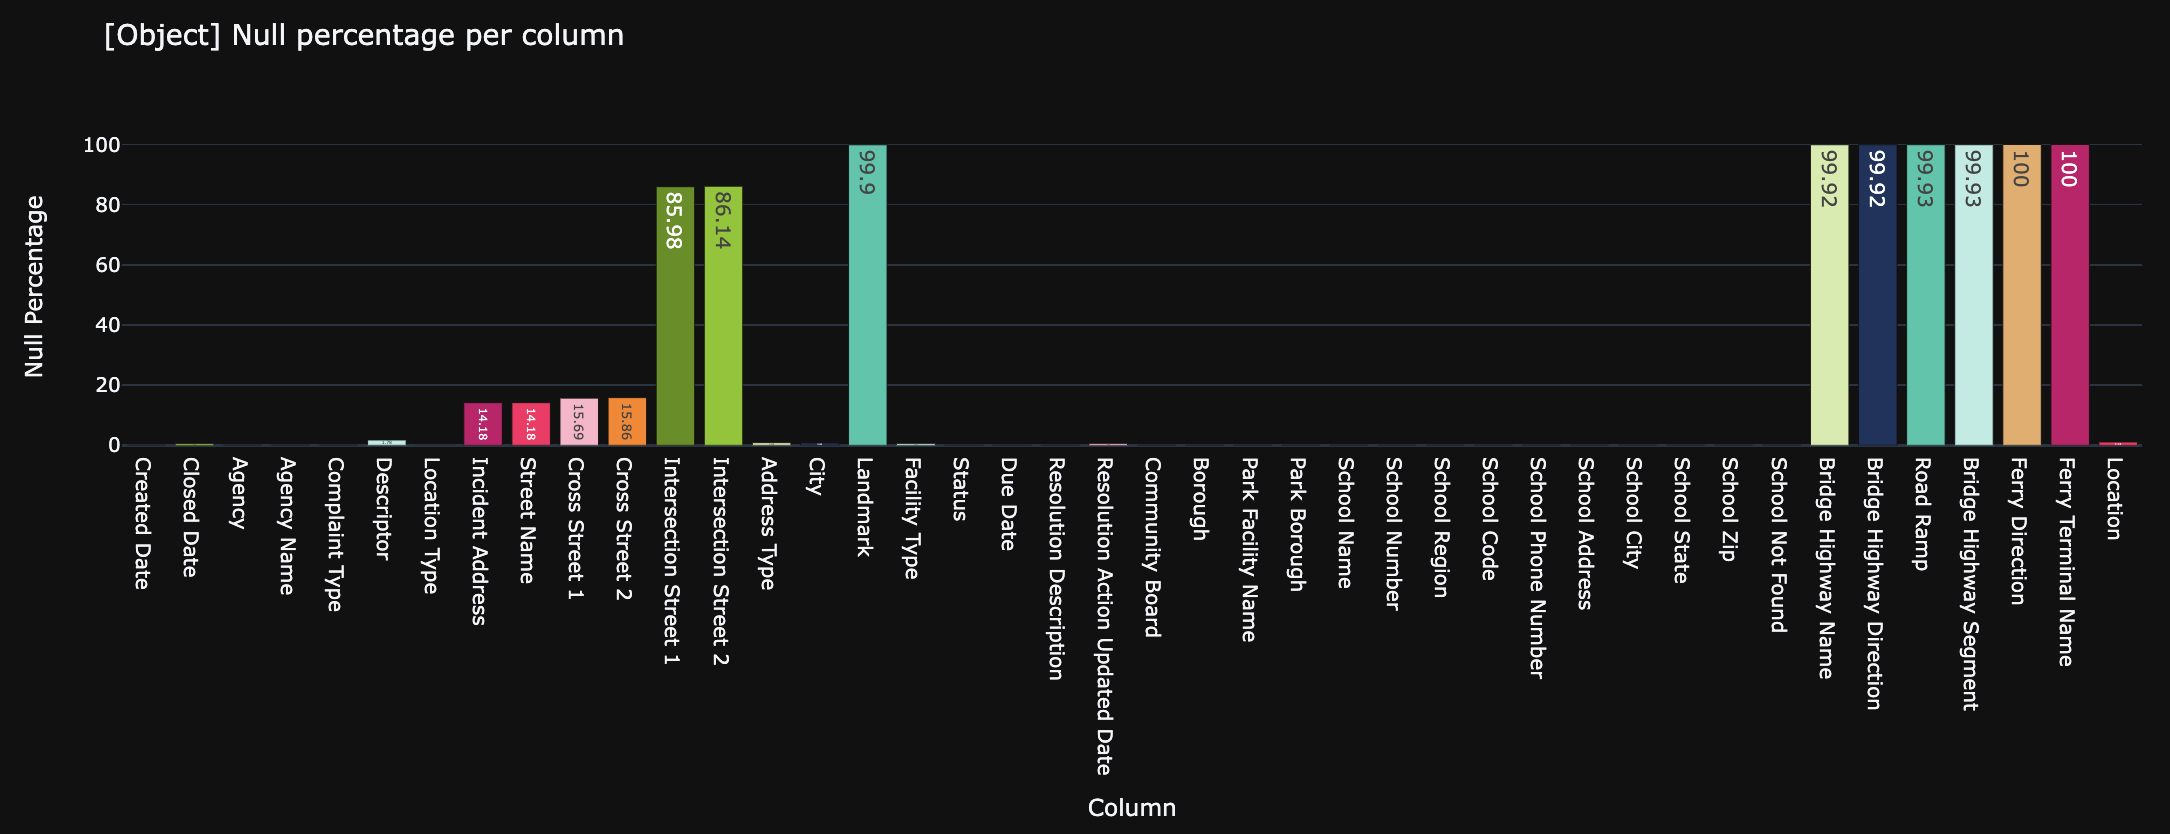
We could see many columns are filled with NaN.
Somes even fill with 100% null values like: Road Ramp, Ferry Direction,
Verhicle Type, ...
Which ones we should replace and which ones we should drop it?
Let's see its weight on the whole dataset.
                columns = []
                perc_null = []
                for column in nyc_df.select_dtypes(include="object"):
                    columns.append(column)
                    perc_null.append(round(nyc_df[column].isna().sum()*100/nyc_df.shape[0], 2))
                obj_null_calc = pd.DataFrame(list(zip(columns,perc_null)), columns=["Column","Null Percentage])
                fig = px.bar(data_frame=obj_null_calc, x="Column", y ="Null Percentage", color="Column", color_discrete_sequence = colors,
                            title= "[Object] Null percentage per column", text="Null Percentage")
                fig.update_layout(showlegend = False)
                fig.update_traces(textposition="inside")
                fig.show()
                columns = []
                perc_null = []
                for column in nyc_df.select_dtypes(include="number"):
                    columns.append(column)
                    perc_null.append(round(nyc_df[column].isna().sum()*100/nyc_df.shape[0], 2))
                num_null_calc = pd.DataFrame(list(zip(columns,perc_null)), columns=["Column","Null Percentage])
                fig = px.bar(data_frame=num_null_calc, x="Column", y ="Null Percentage", color="Column", color_discrete_sequence = colors,
                            title= "[Numeric] Null percentage per column", text="Null Percentage")
                fig.update_layout(showlegend = False)
                fig.update_traces(textposition="inside")
                fig.show()
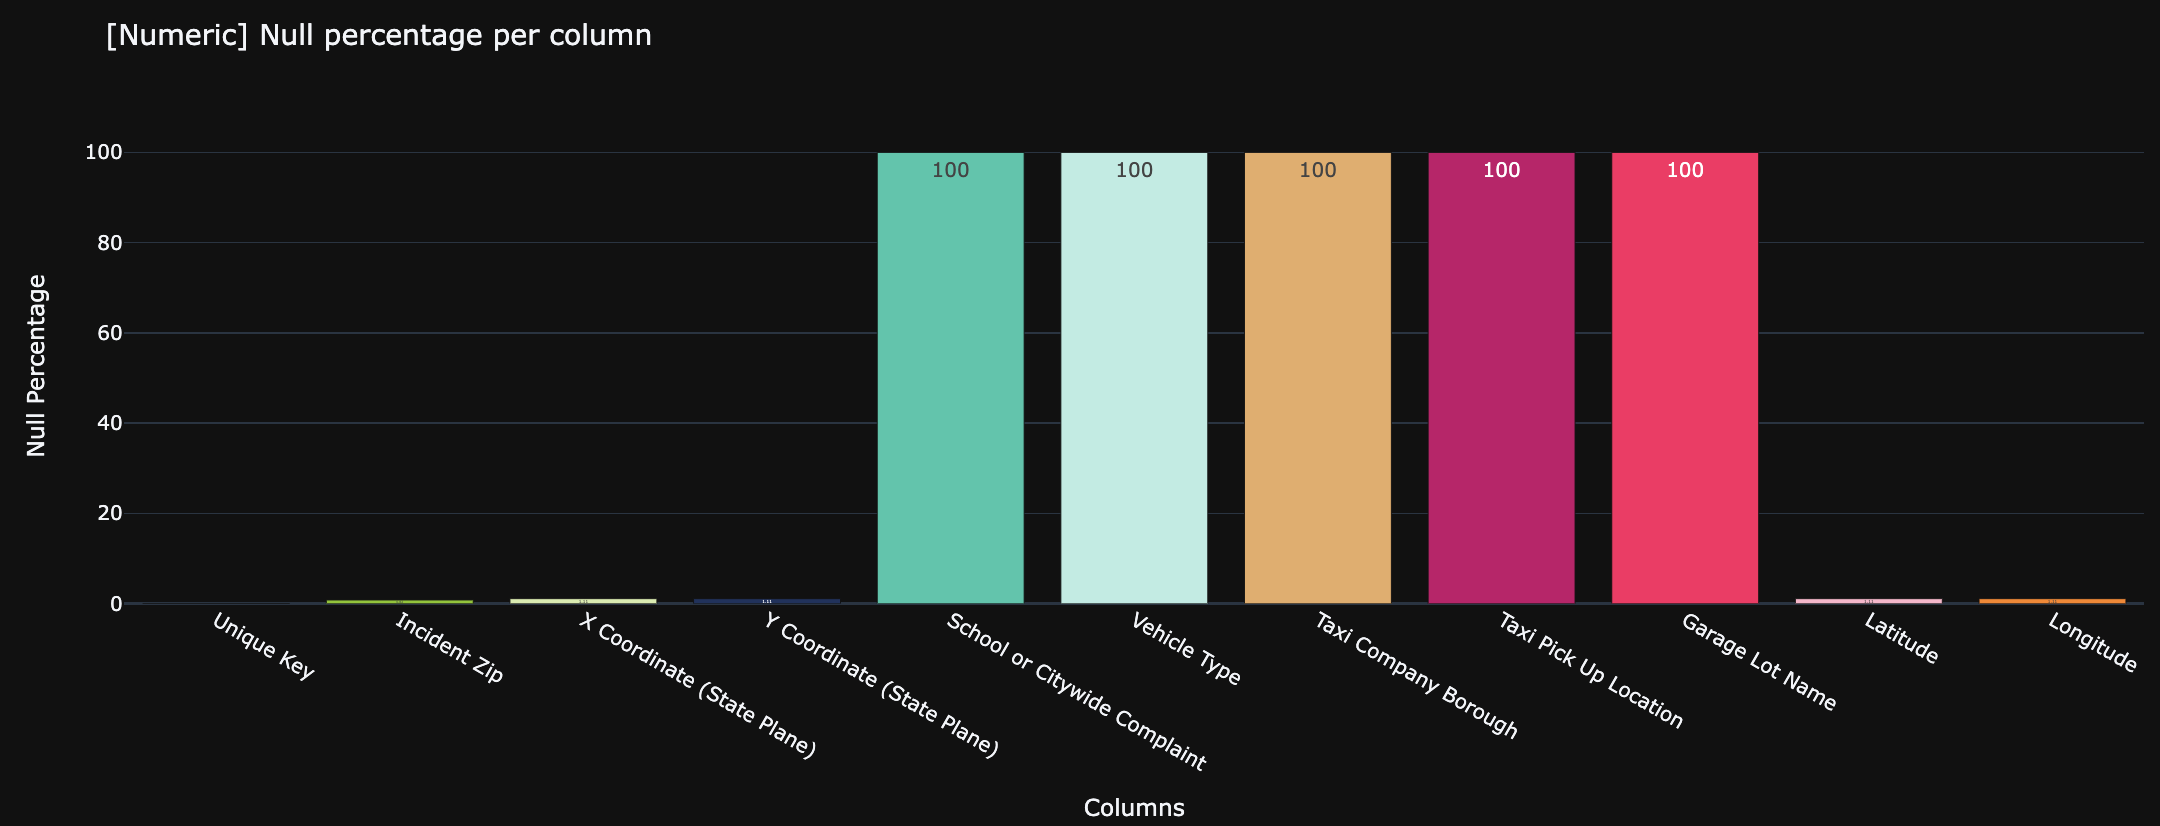
We will drop columns with greater then >10% null percentage => obj + numberic columns = 18 columns will be
dropped.
Since we have 4 columns indicated the position of incident on map, which are lat/long and x/y coordinate.
I would refer to use lat/long so I will drop these 2 x/y coordinate columns as well as location column
(which contains the paired of lat/long).
And I also don't need the Incident Zip.
Below is the remain columns which still contain NaN values and their "missing value relationship".
                limit_null = nyc_df.shape[0]*0.9
                nyc_df_clean = nyc_df.dropna(axis=1, thresh= limit_null)
                nyc_df_clean.drop(columns=["X Coordinate (State Plane)","Y Coordinate (State Plane)", "Location", "Incident Zip"],
                inplace=True)
                mn.dendrogram(nyc_df_clean)
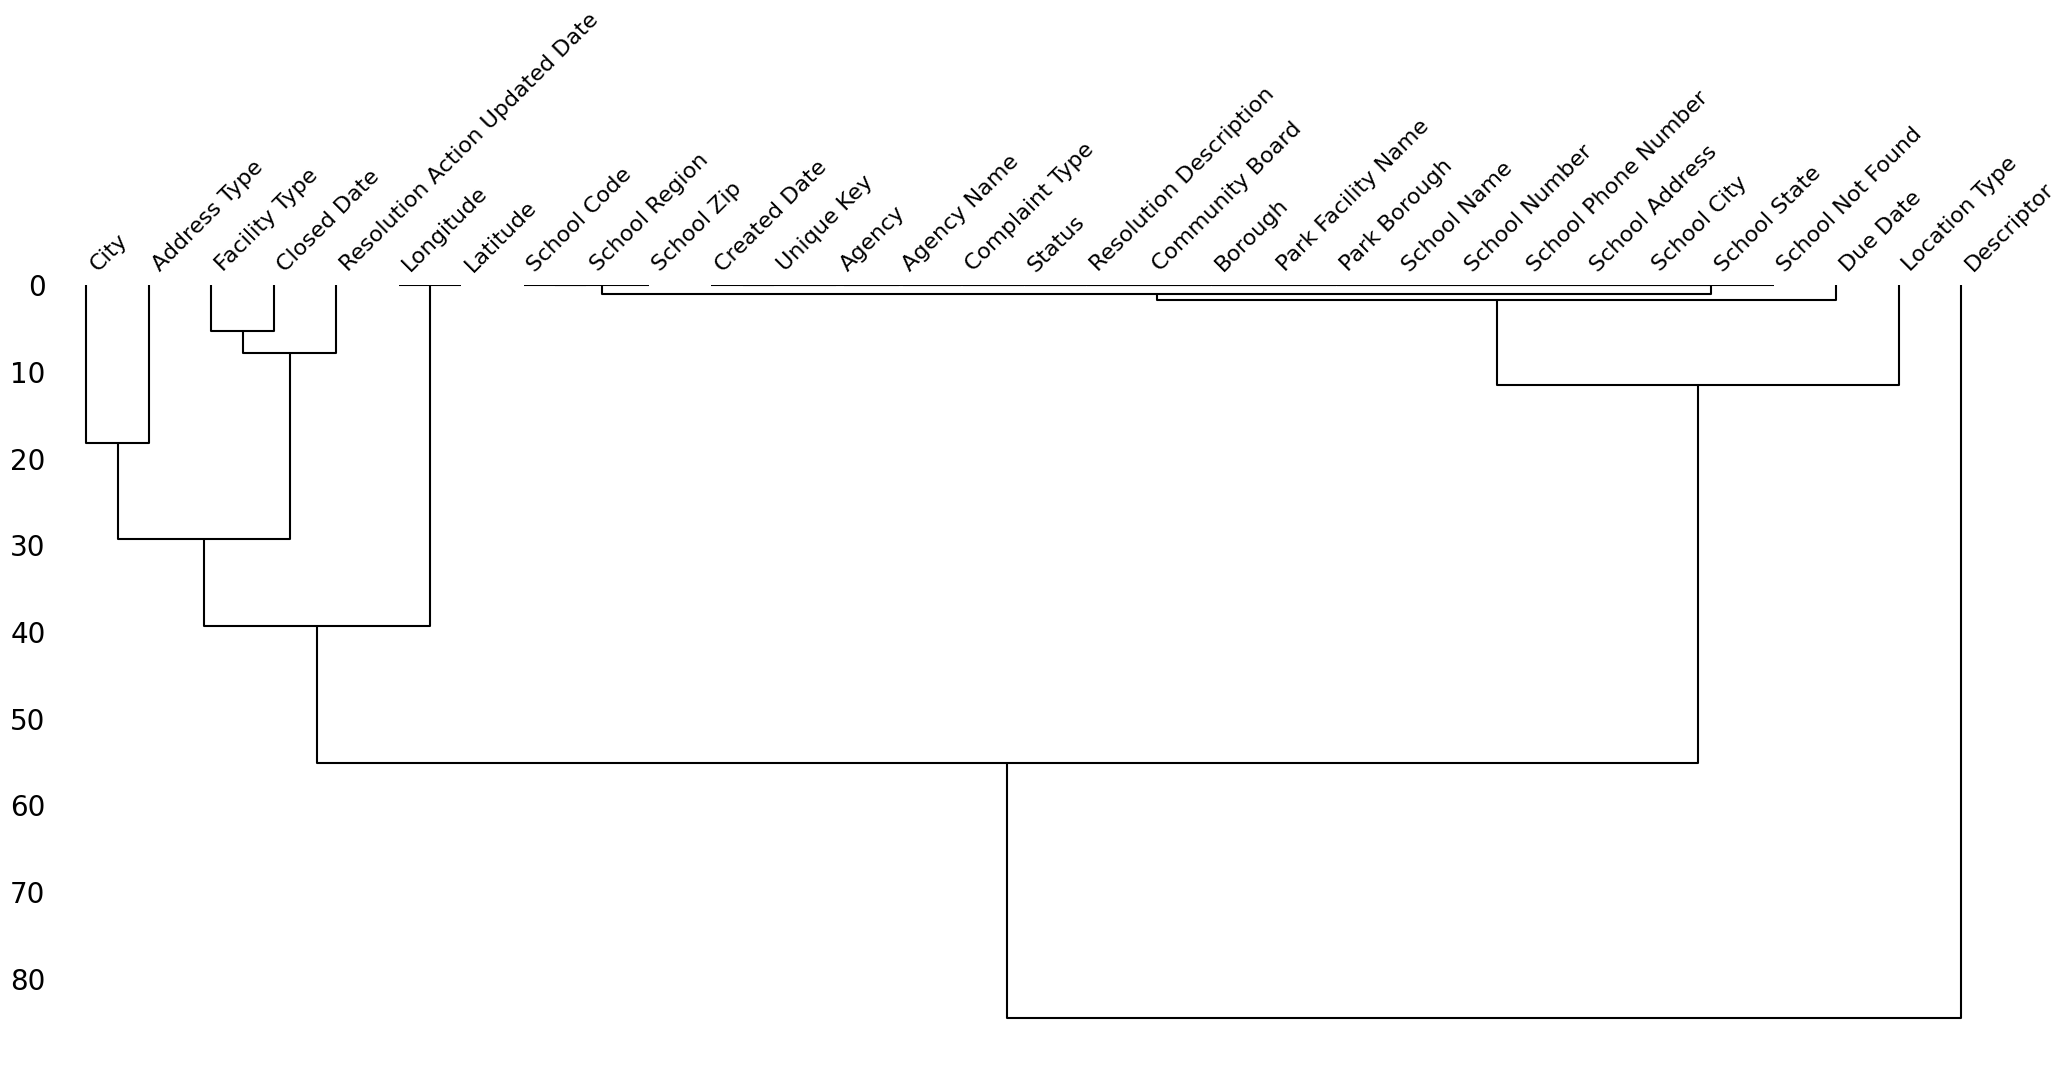
For Descriptor, Location Type, Address Type, City, Facility Type
column,
I will fill the null with "Unspecified".
For Longitude - Latitude, since the dataset is all centered in
NYC. I will replace null value with the mode.
fill_unspecified_list = ["Descriptor", "Location Type", "Address Type", "City", "Facility Type"]
for col in fill_unspecified_list:
nyc_df_clean[col] = nyc_df_clean[col].fillna("Unspecified")
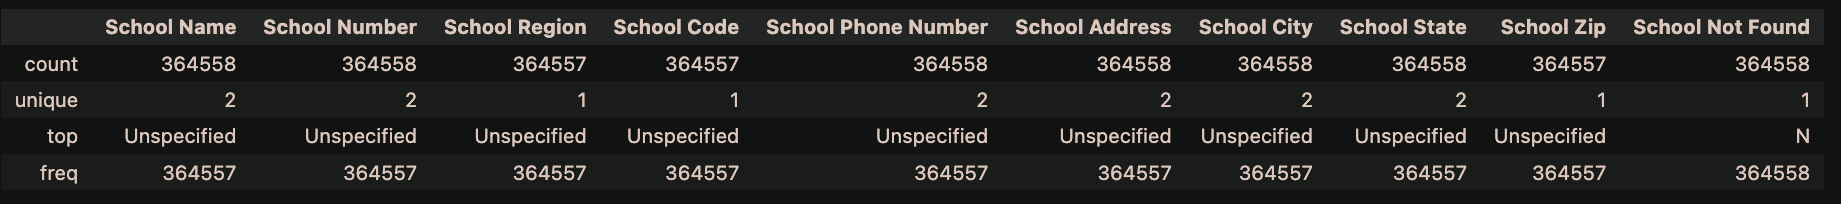
nyc_df_clean.loc[:,nyc_df_clean.columns.str.startswith("School")].describe()
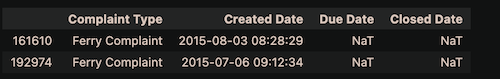
display(nyc_df_clean[nyc_df_clean["Complaint Type"]=="Ferry Complaint"][["Complaint Type","Created Date", "Due Date","Closed Date"]])
We could see that all the columns start with "School" have the top is unspecified. And the
School Not Found has only 1 value is 'N' which is not
informative.
Also, the complaint type Ferry Complaint has no Due Date and Closed Date and 1 missing
Value on Resolution Action Updated Date,
which is not informative too.
Hence, we will drop all these columns for school and all these rows that related to Ferry Complaint.
nyc_df_clean.loc[:,nyc_df_clean.columns.str.endswith("Date")]
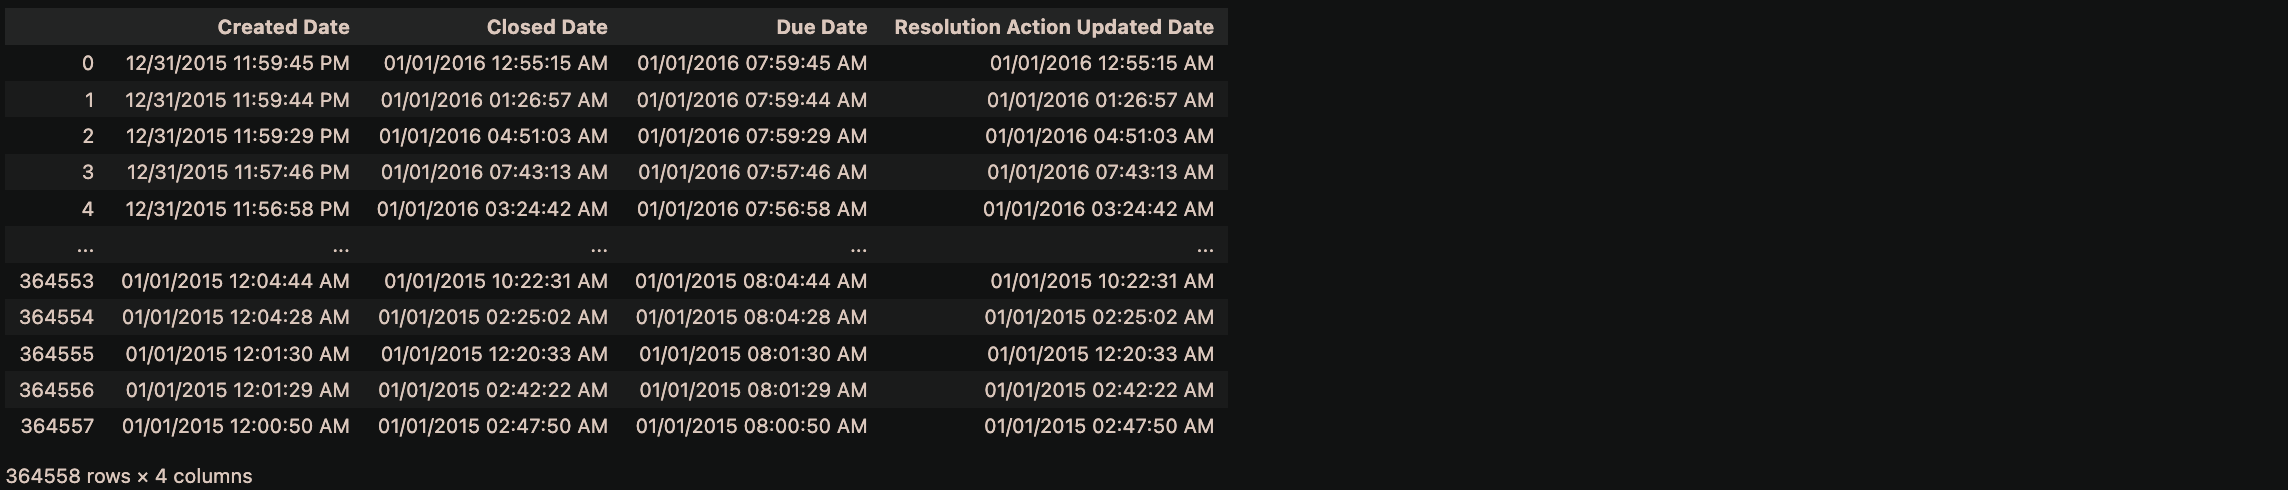
Hold on! It looks like we have date-type columns, before cleaning these columns, let's convert its object-type to datetime.
                date_type_column = nyc_df_clean.loc[:, nyc_df_clean.columns.str.endswith("Date")].columns.values
                for col in date_type_column:
                  nyc_df_clean[col] = pd.to_datetime(nyc_df_clean[col], format="%m/%d/%Y %I:%M:%S %p")

                nyc_df_clean.info()
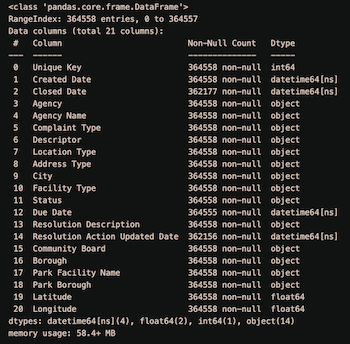
Perfect!
The Due Date column is missing only 1 observation. Let's take
a look on it.
nyc_df_clean[nyc_df_clean["Due Date"].isnull()]
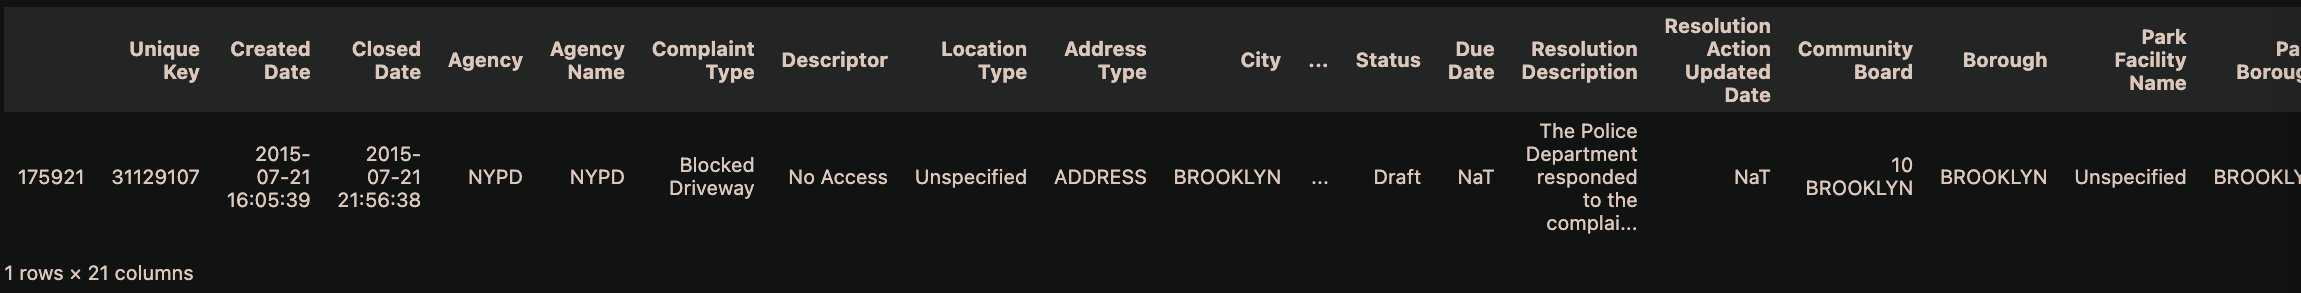
For the remain row of Due Date is NaT and
Resolution Action Updated Date is NaT. We could see that the
Closed Date is same day with the
Created Date
.
So I will fill NaT for Due Date and
Resolution Action Updated Date
with the same value as
Closed Date
.
                mask = (nyc_df_clean["Due Date"].isnull()) & (nyc_df_clean["Resolution Action Updated Date"].isnull())
                nyc_df_clean.loc[mask, ["Due Date", "Resolution Action Updated Date"]] = nyc_df_clean.loc[mask, "Closed Date"]

                nyc_df_clean.groupby("Status")["Closed Date"].apply(lambda x: x.isnull().sum())

We could seen that some Closed Date observation are NaT
because their Status haven't closed yet. So there is no
problem with this column.
But the "Draft" status seems to be useless so I will drop that row.
For the Resolution Action Updated Date, I have performed some
investigation.
So here is the findings and my solution:
- The Resolution Action Updated Date was missing for closed status (2 rows only). But there were closed date already so I will replace these missings with its closed-date.
- The 'Your complaint has been forwarded to the New York Police Department for a
non-emergency response. 311 will have additional information in 8 hours. Please note your service
request number for future reference.'
solution has 100% null values for Resolution Action Updated Date
.
Same as 'Your complaint has been forwarded to the New York Police Department for a non-emergency response. If the police determine the vehicle is illegally parked, they will ticket the vehicle and then you may either contact a private towing company to remove the vehicle or ask your local precinct to contact 'rotation tow'. Any fees charged for towing will have to be paid by the vehicle owner. 311 will have additional information in 8 hours. Please note your service request number for future reference.'
==> For these 2 Resolution Descriptor, we will replace it with the Created Date + 15 minutes - For the remain null value of Resolution Action Updated Date, we will replace with the max duration between Resolution Action Updated Date and Created Date group by each Resolution Descriptor
                mask2 = (nyc_df_clean["Status"] == "Closed") & (nyc_df_clean["Resolution Action Updated Date"].isnull())
                nyc_df_clean.loc[mask2,'"Resolution Action Updated Date"] = nyc_df_clean.loc[mask2, "Closed Date"]

                mask3 = nyc_df_clean["Resolution Description"] == "Your complaint has been forwarded to the New York Police Department
                for a non-emergency response. 311 will have additional information in 8 hours.
                Please note your service request number for future reference."
                nyc_df_clean.loc[mask3, ["Created Date","Closed Date","Due Date"]]

                mask4 = (nyc_df_clean["Resolution Description"] == "Your complaint has been forwarded to the New York Police Department
                  for a non-emergency response. If the police determine the vehicle is illegally parked,
                  they will ticket the vehicle and then you may either contact a private towing company to remove the vehicle or ask your local precinct to contact 'rotation tow'.
                  Any fees charged for towing will have to be paid by the vehicle owner.
                  311 will have additional information in 8 hours.
                  Please note your service request number for future reference.")\
                  & (nyc_df_clean["Closed Date"].notnull())
                nyc_df_clean.loc[mask4, ["Created Date","Closed Date","Due Date"]]

                def fill_na_resolution_date(row):
                  if pd.isnull(row["Resolution Action Updated Date"]) and row["Resolution Description"] in
                    ["Your complaint has been forwarded to the New York Police Department for a non-emergency response. 311 will have additional information in 8 hours.
                      Please note your service request number for future reference.",
                      "Your complaint has been forwarded to the New York Police Department for a non-emergency response. If the police determine the vehicle is illegally parked, they will ticket the vehicle and then you may either contact a private towing company to remove the vehicle or ask your local precinct to contact 'rotation tow'. Any fees charged for towing will have to be paid by the vehicle owner. 311 will have additional information in 8 hours.
                      Please note your service request number for future reference."]:
                    return row["Created Date"] + pd.Timedelta(minutes=15)
                  return row["Resolution Action Updated Date"]

                nyc_df_clean["Resolution Action Updated Date"] = nyc_df_clean.apply(fill_na_resolution_date, axis=1)

                print(nyc_df_clean["Park Facility Name"].value_counts())
                print((nyc_df_clean["Borough"]==nyc_df_clean["Park Borough"]).sum())

The Park Borough has the same value with
Borough, so we just need to keep one of them
Moreover, the Park Facility Name has a huge unspecified value,
so we will drop this columnn.
Analysis
How many agencies here?
nyc_df_clean.groupby("Agency")["Agency Name"].value_counts()

We could see that only one agency value has 3 different Agency Name.
In fact, the Internal Affairs Bureau ("IAB") was set up as a unit within the NYPD that investigates serious police
misconduct as well as police corruption.
Hence, we only have one agency here, it is NYDC or New York City Police Department.
So actually, these 2 columns aren't necessary.
We could drop them but I don't mind to keep them in the dataframe.
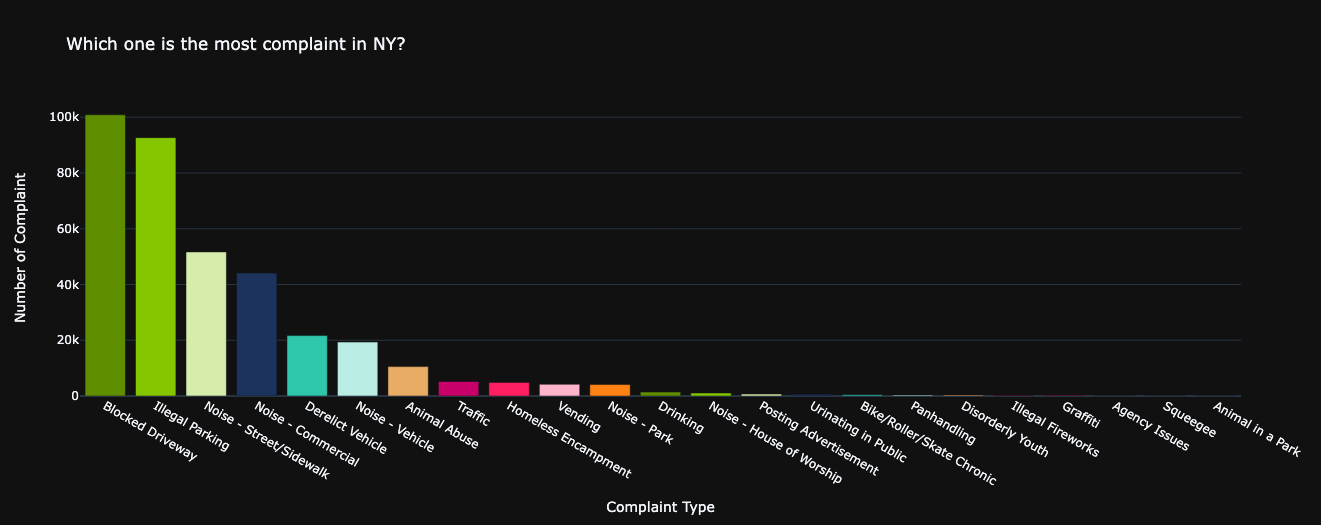
How many complaint type are there?
There are 23 types of complaint raised by people in NYC.
Let's see their contribution and distribution type in each Borough.
                complaint_type_counts = nyc_df_clean["Complaint Type"].value_counts()
                fig = px.bar(x = complaint_type_counts.index, y = complaint_type_counts.values, color=complaint_type_counts.index,
                              color_discrete_sequence=colors,
                              title="Which one is the most complaint in NY?")
                fig.update_layout(showlegend = False, xaxis_title = "Complaint Type", yaxis_title="Number of Complaint")
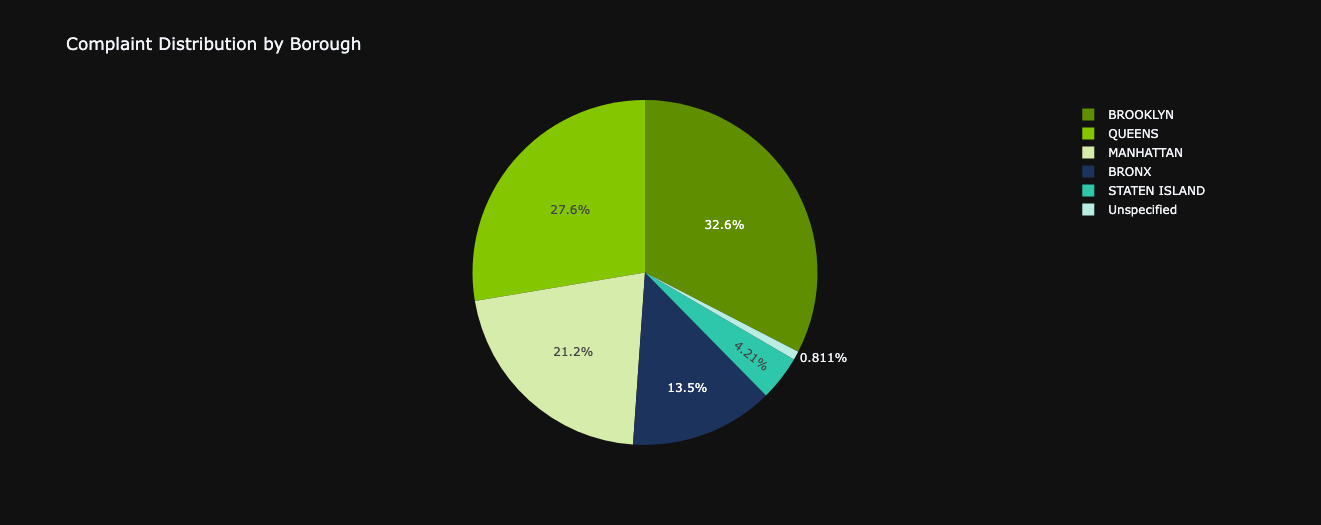
                borough_counts = nyc_df_clean.groupby("Borough").size().reset_index(name="Count")
                fig = px.pie(borough_counts, values="Count", names="Borough", color_discrete_sequence=colors,
                              title= "Complaint Distribution by Borough")
                fig.show()
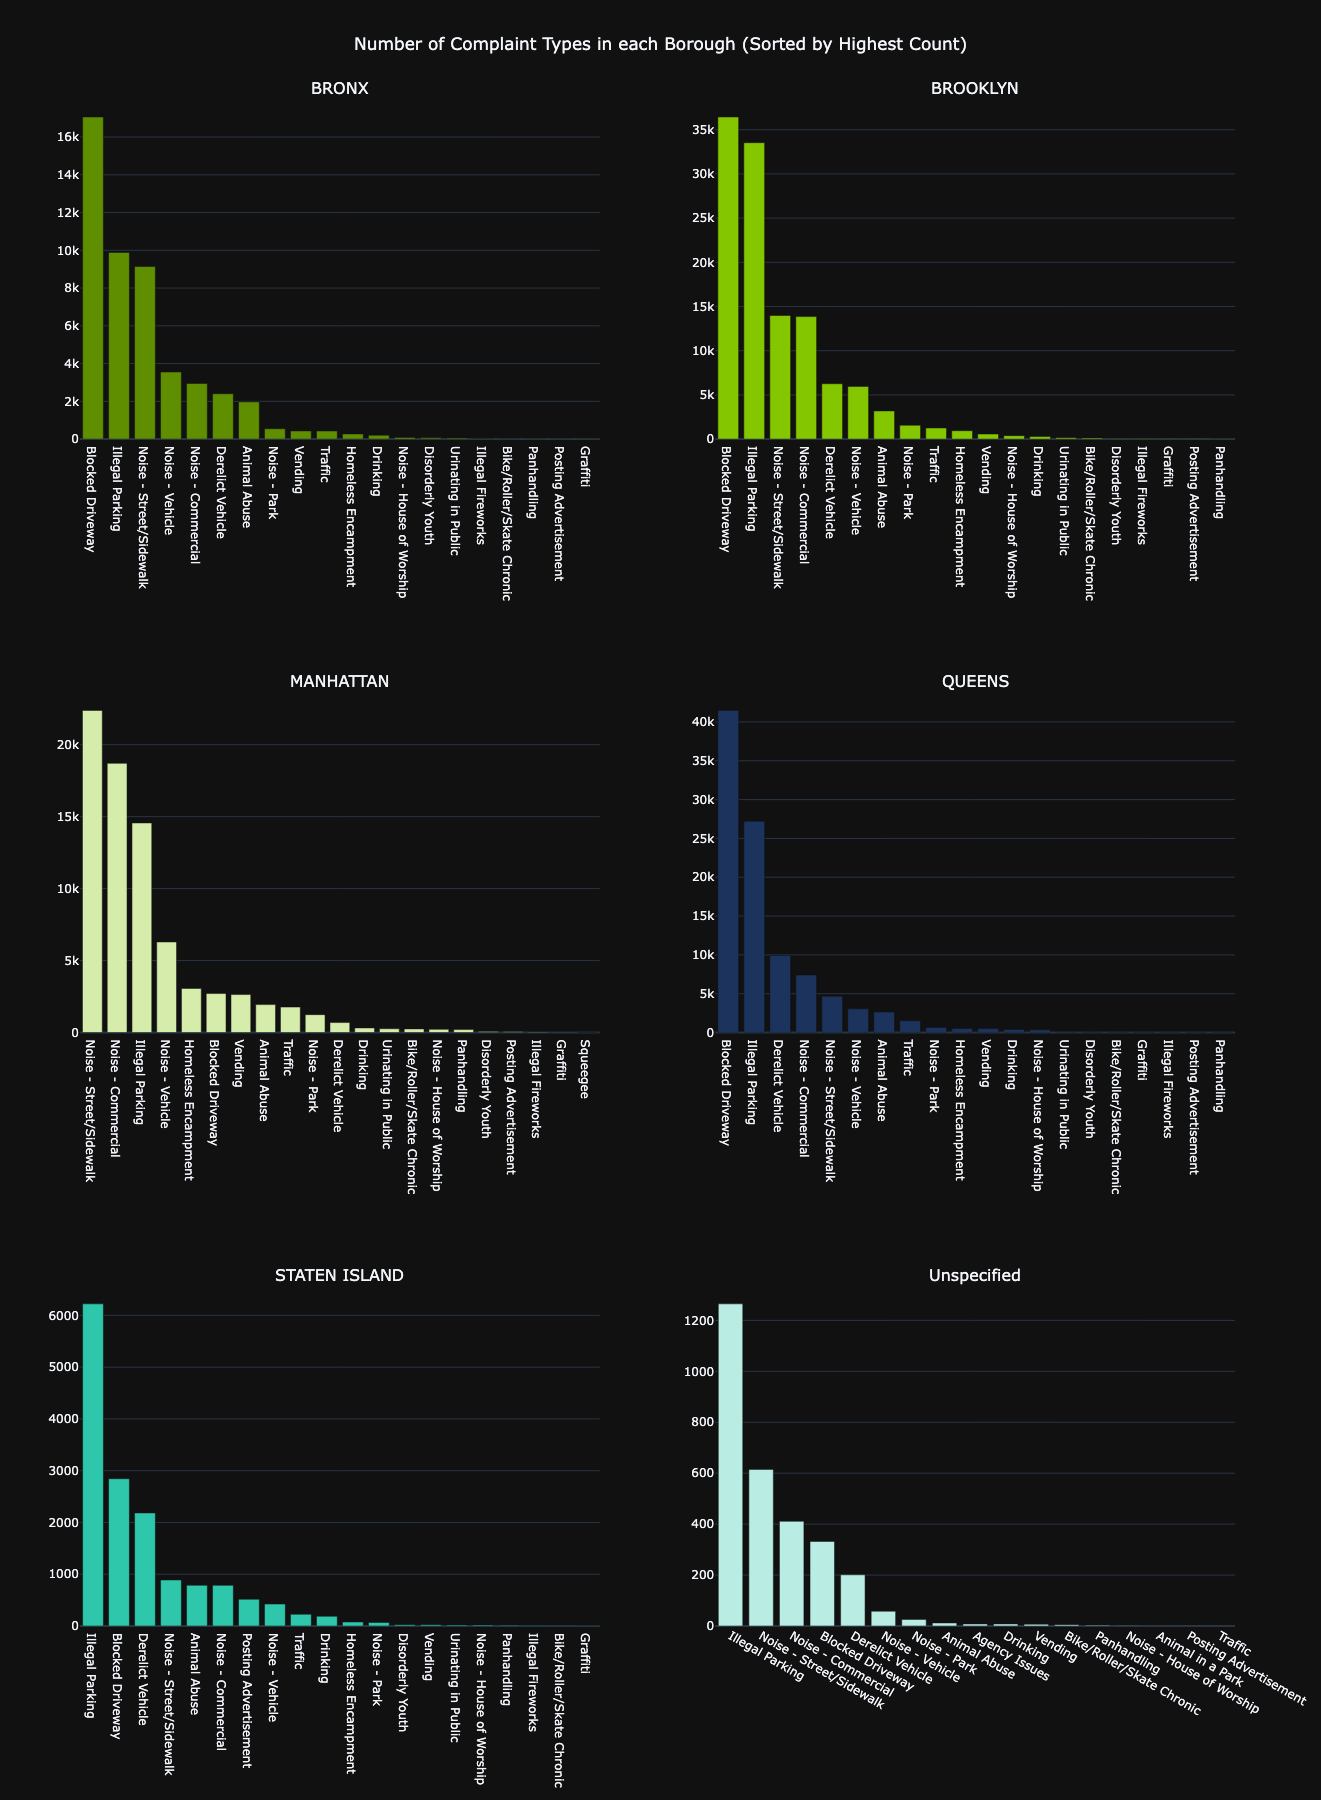
                complaint_counts = nyc_df_clean.groupby(["Borough", "Complaint Type"]).size().reset_index(name="Count")
                complaint_counts = complaint_counts.sort_values(by=["Borough", "Count"], ascending=[True, False])

                num_boroughs = len(complaint_counts["Borough"].unique())
                fig = make_subplots(rows=3, cols=2, subplot_titles=complaint_counts["Borough"].unique())
                color_borough = colors[:len(complaint_counts["Borough"].unique())]

                for i, (borough, color) in enumerate(zip(complaint_counts["Borough"].unique(), color_borough), 1):
                    data_borough = complaint_counts[complaint_counts["Borough"] == borough]

                    fig.add_trace(
                        go.Bar(x=data_borough["Complaint Type"], y=data_borough["Count"], name=borough, marker=dict(color=color)),
                        row= (i - 1) // 2 + 1 , col=(i - 1) % 2 + 1
                    )

                fig.update_layout(
                    height= 600 *(num_boroughs/2),
                    showlegend=False,
                    title_text="Number of Complaint Types in each Borough (Sorted by Highest Count)",
                    title_x=0.5
                )
                fig.show()
In a concise overview, the majority (60.2%) of reported issues stem from the neighborhoods of BROOKLYN and QUEENS.
The prevailing concerns appear to revolve around cases of Blocked Driveways and Illegal Parking.
Interestingly, these two complaint types stand out as the most common across BRONX, BROOKLYN, QUEENS, and STATEN ISLAND,
drawing the highest number of tickets issued by the NYPD.
However, when we shift our attention to MANHATTAN, a distinct pattern emerges. This borough faces a distinctive challenge with Noise problems, with the primary culprits being Noise complaints originating from Street/Sidewalk disturbances and Commercial events.
It's noteworthy that MANHATTAN's top two issues both relate to noise, setting it apart from the other boroughs. MANHATTAN government should take an eye on this.
                blocked_driveway_df = nyc_df_clean[nyc_df_clean["Complaint Type"] == "Blocked Driveway"].groupby("Descriptor").size().reset_index(name = "Count")
                illegal_parking_df = nyc_df_clean[nyc_df_clean["Complaint Type"] == "Illegal Parking"].groupby("Descriptor").size().reset_index(name = "Count")

                fig = make_subplots(rows=1, cols=2, subplot_titles=["Blocked Driveway", "Illegal Parking"],
                                    specs=[[{'type':'domain'}, {'type':'domain'}]])
                fig.add_trace(
                    go.Pie(labels=blocked_driveway_df["Descriptor"], values=blocked_driveway_df["Count"], name="Blocked Driveway"),
                    row=1, col=1
                )
                fig.add_trace(
                    go.Pie(labels=illegal_parking_df["Descriptor"], values=illegal_parking_df["Count"], name="Illegal Parking"),
                    row=1, col=2
                )
                fig.update_layout(
                    title_text="Descriptor Distribution for Blocked Driveway and Illegal Parking",
                    title_x= 0.5
                )
                fig.update_traces( marker=dict(colors=colors, line=dict(color="#ffffff", width=1)))
                fig.show()
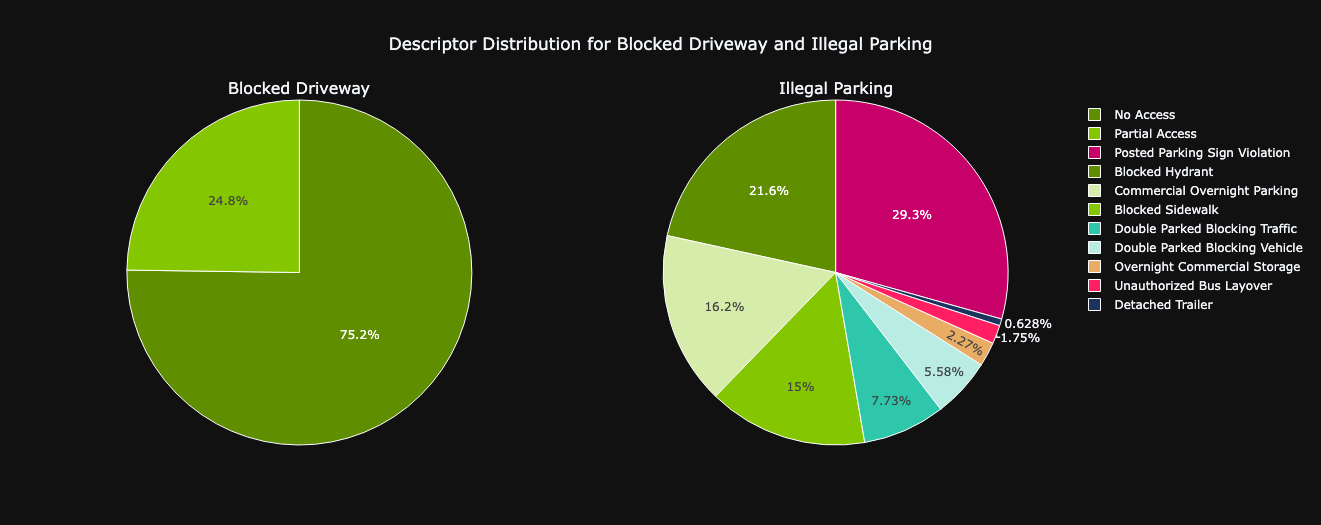
Take a closer look to top 2 common issues :
- Regarding the Blocked Driveway problem, a significant 75% of the descriptors are linked to the issue of 'No Access'.
- On the other hand, when it comes to Illegal Parking complaints, the majority of the concerns (29%) pertain to Violations of Posted Parking signs, closely followed by instances (22%) of Blocked Hydrants.
Status and Complaint Type Process
                nyc_df_status = nyc_df_clean["Status"].value_counts().reset_index(name="Count")
                px.pie(nyc_df_status, values="Count", names="Status", color_discrete_sequence=colors,
                        title="Distribution of Complaint Request Status")
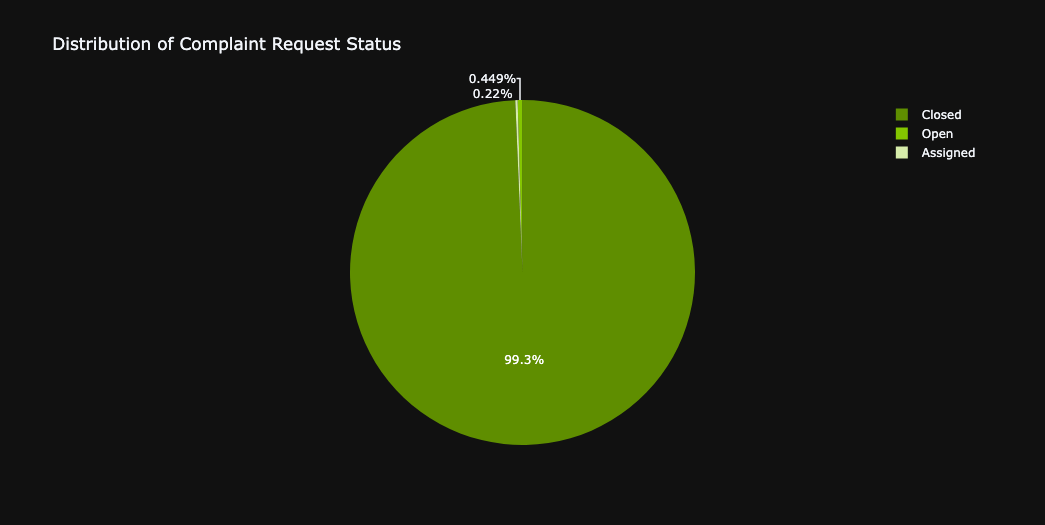
Most of the complaint request has been closed (99,3%) . This means it had been resolved. There are 1638 requests are still opens and 802 requests have been assigned PIC.
                max_duration_closed = closed_df.groupby("Complaint Type")["Duration in Hours"].max().reset_index(name="Maximum").sort_values("Maximum", ascending=False)
                fig = px.bar(max_duration_closed, x="Complaint Type", y ="Maximum",color="Complaint Type",
                              color_discrete_sequence=colors, title = "Maximum duration to close a ticket by Complaint Type")
                fig.update_layout(xaxis_title = "Complaint Type", yaxis_title = "Max Duration in Hours")
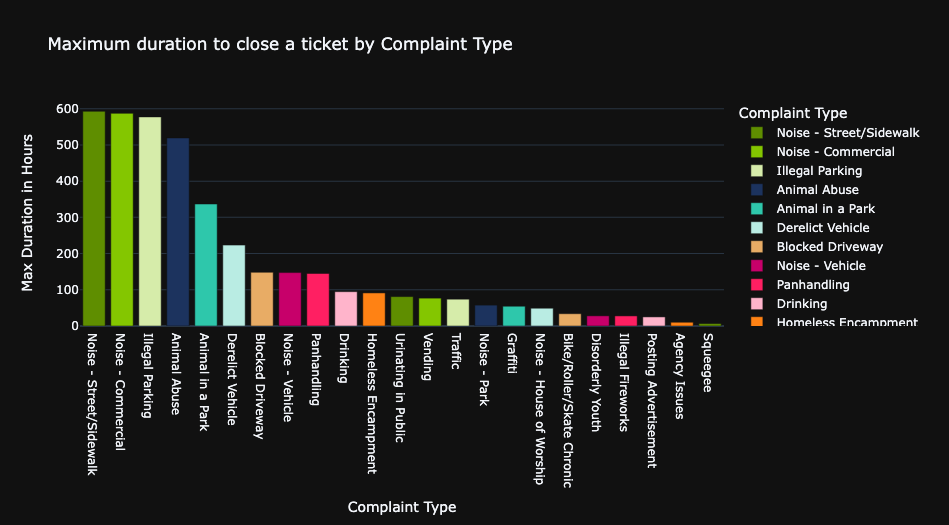
The majority of complaint types are typically addressed and resolved within a relatively short span of two weeks,
equivalent to around 336 hours.
However, it's worth noting that the two complaint types that demand the most extended period for resolution are Noise - Street/Sidewalk and Noise - Commercial.
                nyc_df_clean["Created Date by Day"] = nyc_df_clean["Created Date"].dt.date
                complaint_over_year = nyc_df_clean.groupby(["Created Date by Day", "Complaint Type"]).size().reset_index(name="Count").sort_values("Created Date by Day", ascending=True)
                fig = px.area(complaint_over_year, x="Created Date by Day", y = "Count",
                              color="Complaint Type", color_discrete_sequence=colors)
                fig.update_layout(xaxis_title="Date", yaxis_title="Number of Complaint",
                              title = "Number of Complaint Through Year")
                fig.show()
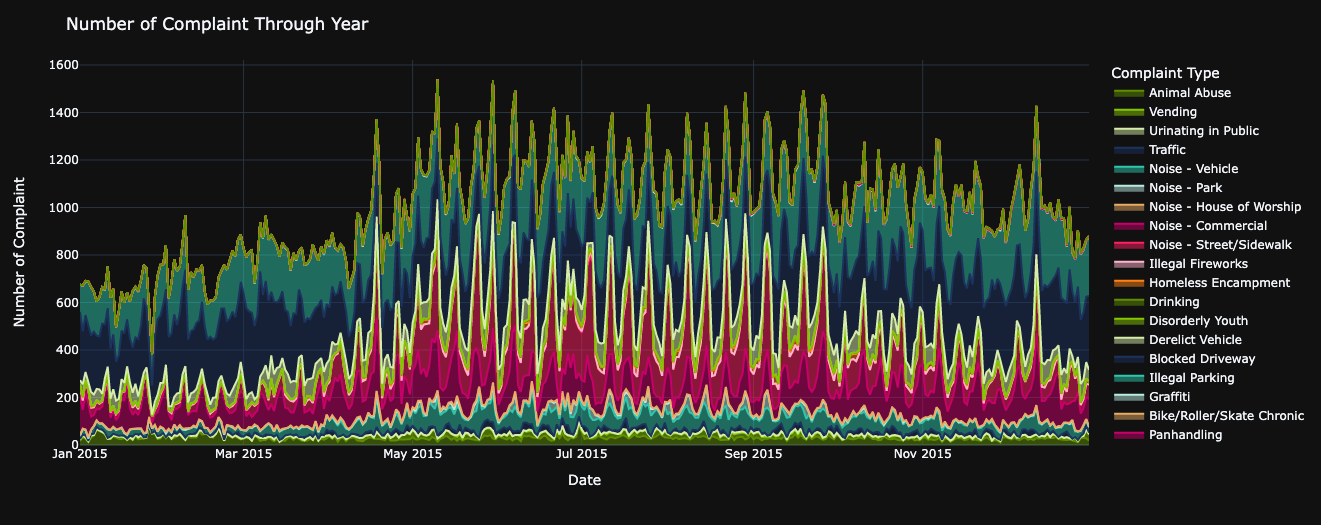
Since May 2015, there has been a noticeable uptick in the number of complaints, primarily attributed to Noise - Street/Sidewalk issues.
Interestingly, during the same period, the frequency of Blocked Driveway complaints experienced a decline from May through the end of September.
                nyc_df_clean["Created Date by Hour"] = nyc_df_clean["Created Date"].dt.hour
                complaint_over_hour = nyc_df_clean.groupby(["Created Date by Hour","Complaint Type"]).size().reset_index(name="Count")
                fig = px.area(complaint_over_hour, x="Created Date by Hour", y='Count', color="Complaint Type", color_discrete_sequence=colors, pattern_shape="Complaint Type")
                fig.update_layout(xaxis_title="Number of Complaint", yaxis_title = "Hour", title ="Number of Complaint in year 2015 by Hour")
                fig.show()
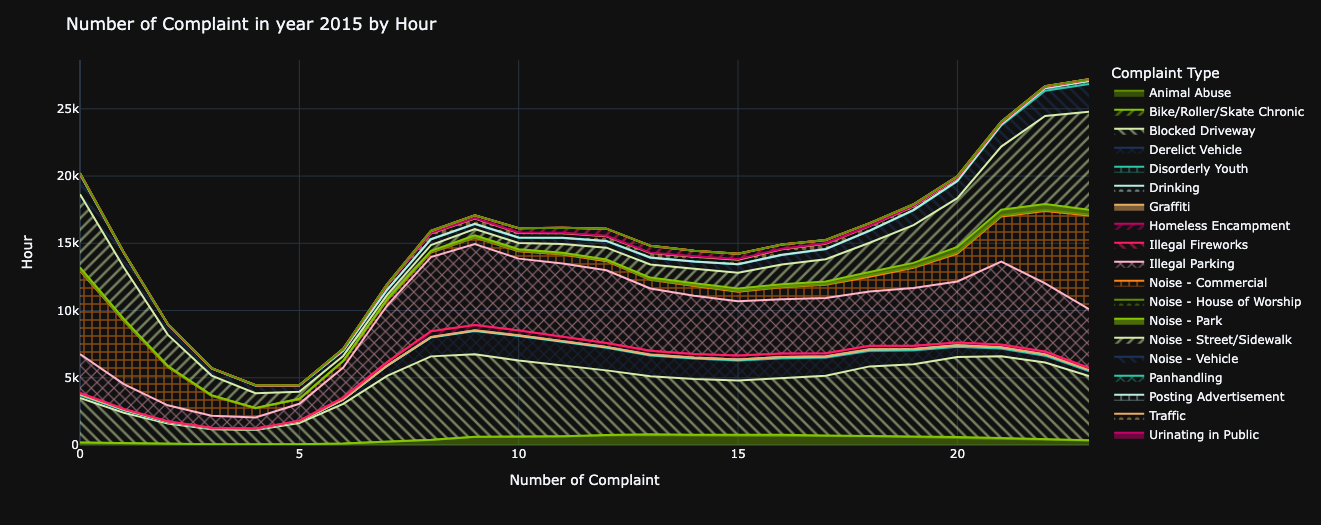
One can readily observe that the count of complaints initiated experiences a gradual rise from 5 A.M.,
peaking around midnight.
This trend suggests a consistent increase in complaint creation throughout the day, with the highest numbers recorded during the late hours.
                day_of_week = {
                  0: "Monday",
                  1: "Tuesday",
                  2: "Wednesday",
                  3: "Thursday",
                  4: "Friday",
                  5: "Saturday",
                  6: "Sunday"
              }

              nyc_df_clean["Created Date by Weekday"] = nyc_df_clean["Created Date"].dt.weekday.map(day_of_week)
              complaint_over_week = nyc_df_clean.groupby(["Created Date by Weekday", "Complaint Type"]).size().reset_index(name="Count")
              fig = px.bar(complaint_over_week, x="Created Date by Weekday", y="Count", color="Complaint Type",
                          color_discrete_sequence=colors, pattern_shape="Complaint Type",
                          category_orders={"Created Date by Weekday": ["Monday",
                          "Tuesday",
                          "Wednesday",
                          "Thursday",
                          "Friday",
                          "Saturday",
                          "Sunday"]})
              fig.update_layout(xaxis_title="Weekday", yaxis_title="Number of complaint",
                                title="Number of complaint in year 2015 by Weekday")
              fig.show()
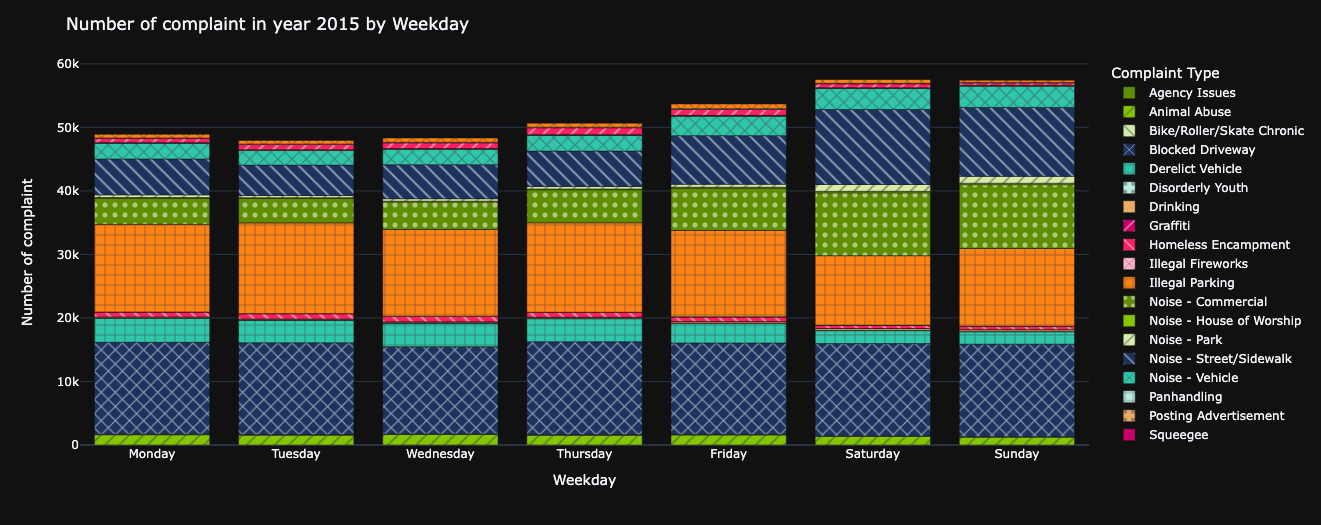
The NYC department's busiest period occurs over the weekends.
Notably, both Saturday and Sunday witness a rise in Noise complaints stemming from Commercial and Street/Sidewalk sources.
This pattern can likely be attributed to the surge in social activities that typically unfold during the weekends.
Location investigation
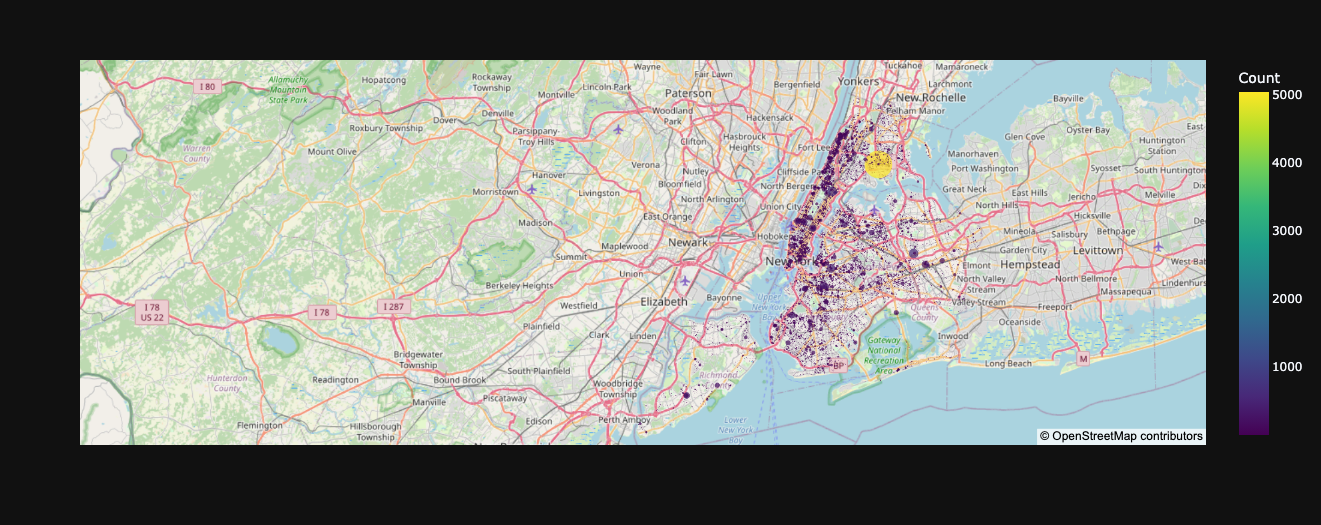
Complaint ticket counted:
                geo_df = nyc_df_clean.groupby(["Latitude","Longitude"]).size().reset_index(name="Count")
                fig = px.scatter_mapbox(geo_df,
                        lat="Latitude",
                        lon="Longitude"',
                        color="Count",
                        color_continuous_scale="viridis",
                        size="Count",
                        hover_name="Count",
                        hover_data=["Latitude", "Longitude"],
                        mapbox_style="open-street-map",
                        center=dict(lat=40.7128, lon=-74.0060),  # Center around NYC
                        zoom=10  # Zoom level
                        )
                fig.show()
                geo_complaint_df = nyc_df_clean.groupby(["Complaint Type","Latitude","Longitude"]).size().reset_index(name="Count")
                fig = px.scatter_mapbox(geo_complaint_df,
                        lat="Latitude",
                        lon="Longitude"',
                        color="Complaint Type",
                        size="Count",
                        hover_name="Complaint Type",
                        hover_data=["Count"],
                        mapbox_style="carto-positron",
                        title="Cluster Plot for All Complaint Types",
                        center=dict(lat=40.7128, lon=-74.0060),  # Center around NYC
                        zoom=10  # Zoom level
                        )
                fig.show()
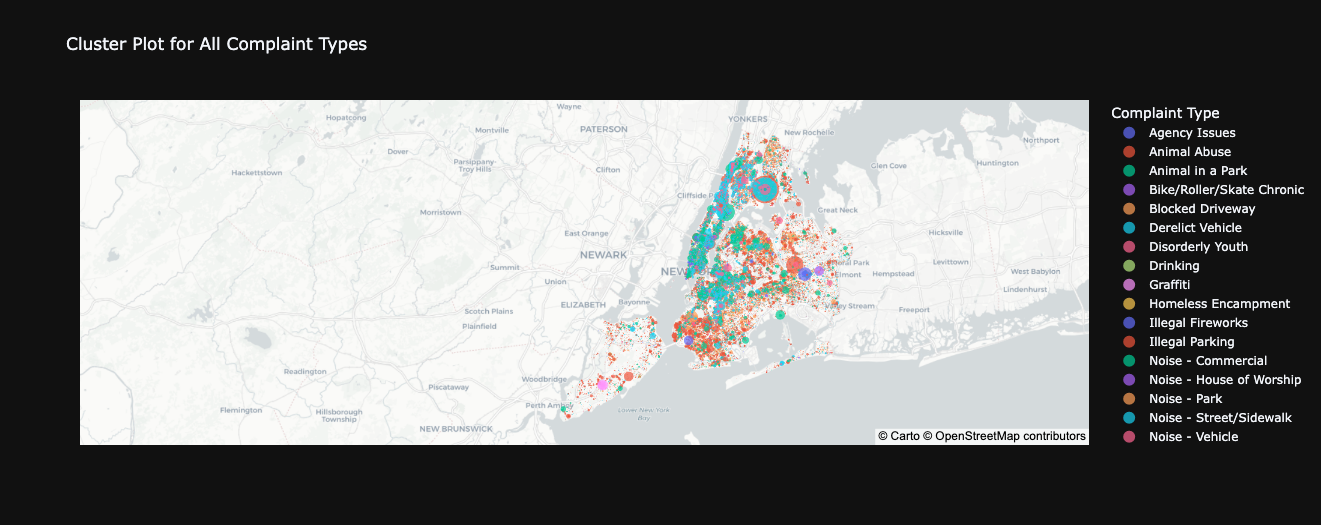
An interesting insight from the map analysis is that distinct issue patterns seem to emerge based on varying geographical ranges.
It becomes evident that the same type of issue tends to recur within specific areas,
implying that different locales don't encounter identical problems universally.
This discrepancy could potentially be attributed to the unique urban dynamics, borough characteristics, street cultures, and inherent behavioral patterns across the city.
                geo_borough_df = nyc_df_clean.groupby(["Borough","Latitude","Longitude"]).size().reset_index(name="Count")
                fig = px.scatter_mapbox(geo_borough_df,
                        lat="Latitude",
                        lon="Longitude"',
                        color="Borough",
                        size="Count",
                        hover_name="Borough",
                        hover_data=["Count"],
                        mapbox_style="carto-positron",
                        title="Cluster Plot for All Borough",
                        center=dict(lat=40.7128, lon=-74.0060),  # Center around NYC
                        zoom=10  # Zoom level
                        )
                fig.show()
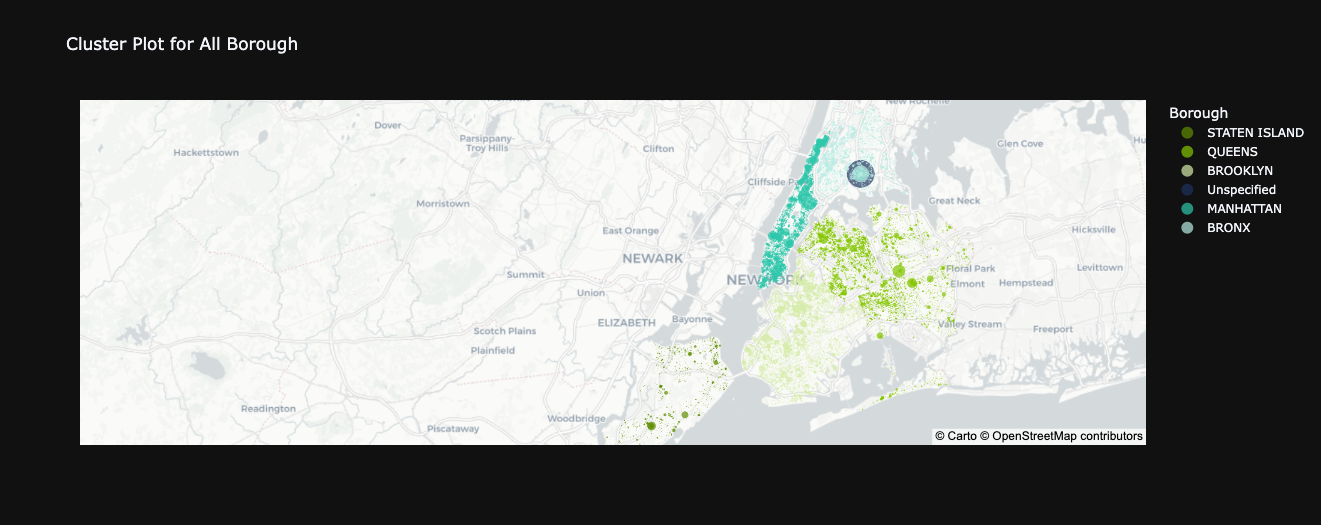
Upon examining the plotted map, a distinct observation comes to light: Unspecified data points are notably clustered
within the BRONX region.
What's intriguing is that a significant portion of these data points correspond to Noise-related issues and instances
of illegal parking, fewer is about Derelict Vehicle and Vending.